This project focuses on developing a Streamlit-based web application that predicts stock prices by utilizing historical stock data, real-time financial metrics, and market sentiment from news articles. The app integrates several APIs, including Yahoo Finance, Finnhub, and NewsAPI, to gather and analyze relevant data. By employing Facebook’s Prophet for time series forecasting and incorporating advanced technical analysis tools, the app provides users with valuable insights into stock market performance.
Key Features of the Stock Price Prediction App
The app was designed to be user-friendly while still delivering powerful analytical capabilities.
It provides a range of features:
- Historical Data Visualization: Interactive candlestick charts allow users to explore historical stock price movements over time, offering a clear view of trends and price fluctuations.
- Stock Price Prediction: Utilizing Facebook’s Prophet library, the app forecasts future stock prices based on historical data. These predictions come with built-in uncertainty intervals, helping users understand the potential range of outcomes.
- Real-Time Financial Metrics: By integrating the Finnhub API, the app displays key financial metrics such as price-to-earnings (PE) ratios, earnings per share (EPS), and market capitalization.
- News and Sentiment Analysis: Powered by the NewsAPI, the app fetches relevant news articles related to the selected stock. It also uses TextBlob to perform sentiment analysis, giving users an overview of whether the news is positive, neutral, or negative.
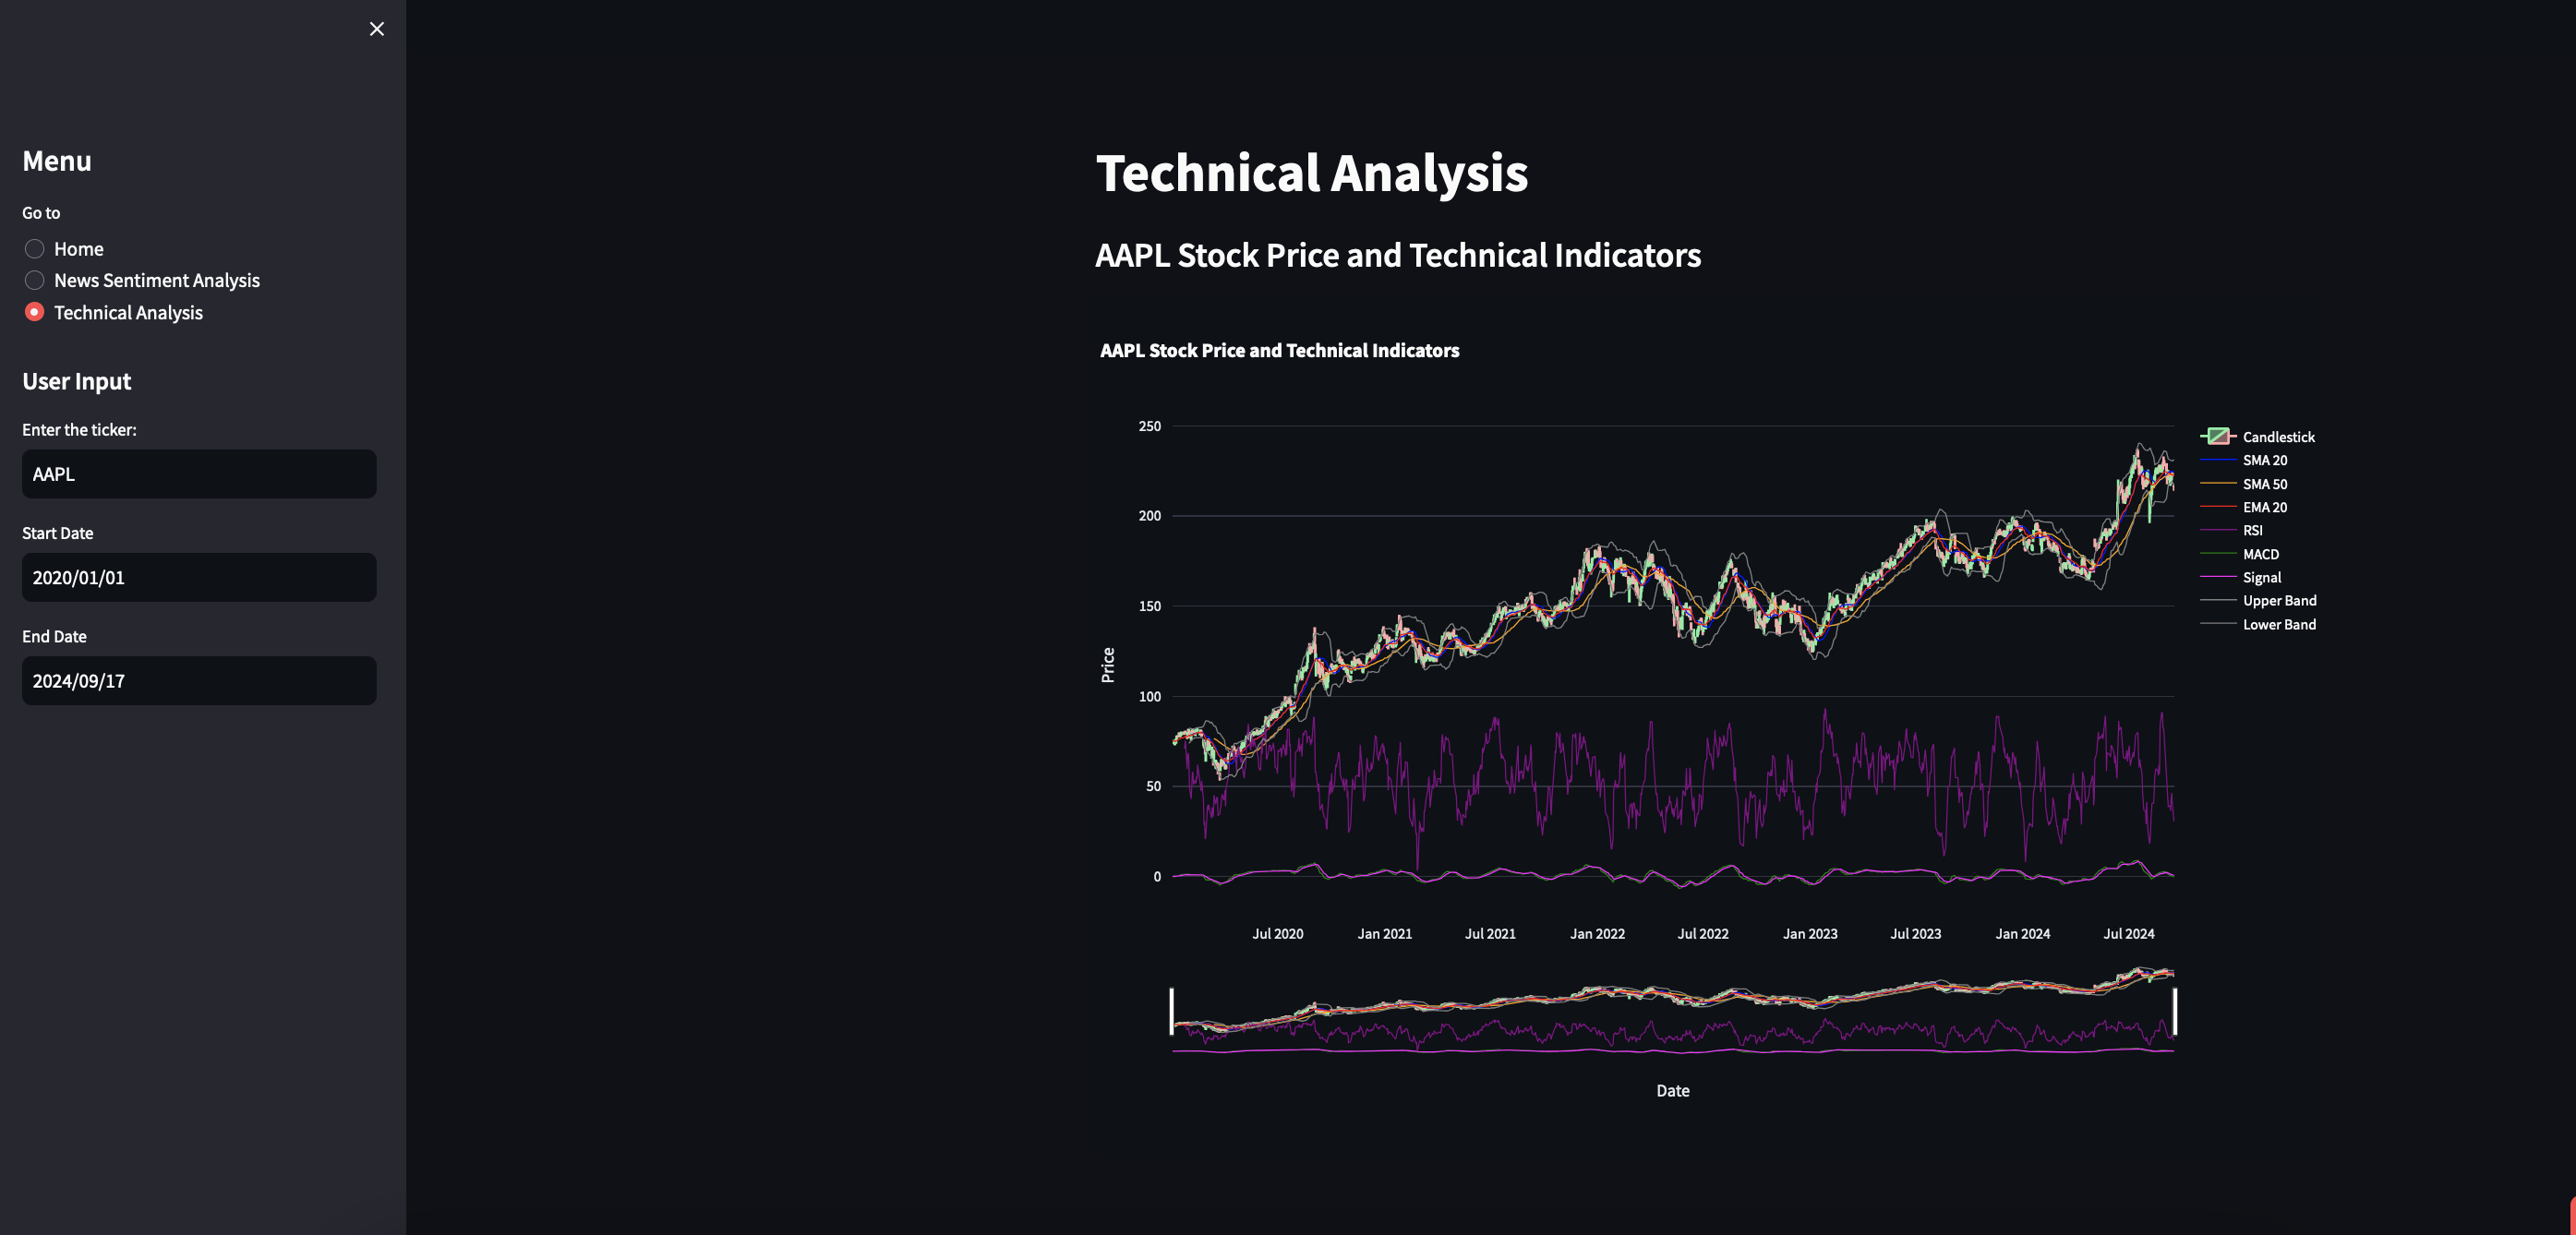
- Technical Indicators: For deeper analysis, the app includes advanced tools such as Simple Moving Averages (SMA), Relative Strength Index (RSI), MACD (Moving Average Convergence Divergence), and Bollinger Bands, allowing users to perform comprehensive technical analysis.
Using Prophet for Stock Price Forecasting
At the core of the app’s forecasting capabilities is Facebook’s Prophet, a time series forecasting model designed to handle complex data patterns, making it ideal for predicting stock prices. Prophet decomposes time series data into three main components:
- Trend: The long-term movement in stock prices.
- Seasonality: Repeating patterns that occur over specific intervals (e.g., weekly, yearly).
- Holiday Effects: Adjustments for price movements that occur during holidays or special events.
Prophet’s strength lies in its ability to handle missing data, outliers, and seasonal patterns, all of which are common in stock market data. The app gathers historical stock data using the yfinance library, cleans and prepares it for Prophet, and then generates predictions that help users anticipate future stock movements.
Real-Time Market News and Sentiment Analysis
In addition to price forecasts, staying updated with the latest news is crucial. The app integrates with the NewsAPI to fetch real-time articles about the stock, allowing users to stay informed about key market developments. To add another layer of analysis, the app performs sentiment analysis using TextBlob, determining whether the news articles reflect positive, neutral, or negative sentiment.
This feature is particularly useful for users who want to gauge how the media and market sentiment may impact the stock’s future performance.
Technical Indicators for In-Depth Analysis
The Stock Price Prediction App includes several key technical indicators to assist users in analyzing stock performance from a technical perspective:
- Simple Moving Average (SMA): A widely used indicator that helps smooth out price data to reveal trends.
- Relative Strength Index (RSI): A momentum oscillator that indicates whether a stock is overbought or oversold, helping investors identify potential reversals.
- MACD (Moving Average Convergence Divergence): A trend-following momentum indicator that shows the relationship between two moving averages, helping to spot potential buy or sell signals.
- Bollinger Bands: A volatility indicator that helps identify whether a stock is trading near its upper or lower price boundaries.
These technical indicators, combined with real-time data and predictive modeling, provide users with a comprehensive toolkit for stock market analysis.
Conclusion: A Simple and Effective Tool for Stock Market Analysis
The Stock Price Prediction App provides a practical and easy-to-use platform for analyzing stock trends and predicting future prices. By combining historical data with real-time financial information and using tools like Facebook’s Prophet for forecasting, the app gives users valuable insights into stock performance.